I hadn’t blogged here in a long while, but honouring International Open Access Week I dedicated a couple of hours to this humble offering.
Today academia saw the publication of the Times Higher Education World University Rankings “Subject Ranking 2015-2016: Arts and humanities top 100 in partnership with Elsevier”. According to their web page,
“The 2015-2016 Times Higher Education World University Rankings’ arts and humanities table judges world class universities across all of their core missions – teaching, research, knowledge transfer and international outlook.”
In terms of number of institutions represented in the “top 100”, the table shows a clear dominance of institutions located in the United States and the United Kingdom, followed at a considerable distance by Germany.
I took the data offered by THE and sorted the countries according to the number of institutions they had on the list (not by ranking):
| Country | |
| United States of America |
32 |
| United Kingdom |
20 |
| Germany |
11 |
| Netherlands |
4 |
| Australia |
3 |
| Canada |
3 |
| Italy |
3 |
| Spain |
3 |
| Switzerland |
3 |
| Belgium |
2 |
| Denmark |
2 |
| France |
2 |
| Austria |
1 |
| China |
1 |
| Finland |
1 |
| Hong Kong |
1 |
| Israel |
1 |
| Japan |
1 |
| Mexico |
1 |
| Republic of Ireland |
1 |
| Russian Federation |
1 |
| Singapore |
1 |
| South Africa |
1 |
| Sweden |
1 |
Please note there are whole regions of the world represented by only one single institution from one single country; for example UNAM, Mexico from the American continent below the US border, Cape Town, South Africa from the whole African continent, or just one institution from the massive Russian Federation (6.602 million mi²).
The dominance of not even a handful but a couple of countries in this Arts and Humanities subject ranking may seem obvious to everyone, but just in case I created a couple of simple Google maps locating where the institutions in this “top 100” are. Hopefully by seeing where they are, we cannot avoid seeing where they are not.
Wide wide empty spaces. There be dragons (just an example…) pic.twitter.com/BGiXOUh00F
— Ernesto Priego (@ernestopriego) October 21, 2015
[Update 24 October 2015]
Brett Bobley was kind enough to offer feedback:
@ernestopriego Thanks, Ernesto. What about population? Have you tried figuring out # top unis per capita per country? Be interesting to see!
— Brett Bobley (@brettbobley) October 21, 2015
I have looked at the World Bank Data‘s Education and Population Indicators, and have complemented my data table with new columns (commas in figures for human readability):
| Country | Population, total | Population ages 15-64 (% of total) | GDP (USD) | Government expenditure on education, total (% of GDP) | Number of Institutions in Arts and Humanities Top 100 |
| United States of America |
318,857,056 |
67 |
17,419,000,000,000 |
5.2 |
32 |
| United Kingdom |
64,510,376 |
65 |
2,941,885,537,461 |
5.8 |
20 |
| Germany |
80,889,505 |
66 |
3,852,556,169,656 |
4.8 |
11 |
| Netherlands |
16,854,183 |
66 |
869,508,125,480 |
5.5 |
4 |
| Australia |
23,490,736 |
67 |
1,453,770,210,672 |
4.9 |
3 |
| Canada |
35,540,419 |
68 |
1,786,655,064,510 |
5.3 |
3 |
| Italy |
61,336,387 |
67 |
2,144,338,185,065 |
4.1 |
3 |
| Spain |
46,404,602 |
67 |
1,404,306,536,058 |
4.4 |
3 |
| Switzerland |
8,190,229 |
67 |
685,434,208,917 |
5.0 |
3 |
| Belgium |
11,225,207 |
65 |
533,382,785,676 |
6.4 |
2 |
| Denmark |
5,639,565 |
64 |
341,951,607,730 |
8.5 |
2 |
| France |
66,206,930 |
63 |
2,829,192,039,172 |
5.5 |
2 |
| Austria |
8,534,492 |
67 |
436,343,622,435 |
5.6 |
1 |
| China |
1,364,270,000 |
74 |
10,360,105,247,908 |
1 |
|
| Finland |
5,463,596 |
64 |
270,673,584,162 |
7.2 |
1 |
| Hong Kong |
7,241,700 |
74 |
290,896,409,544 |
3.8 |
1 |
| Israel |
8,215,300 |
61 |
304,226,336,270 |
5.6 |
1 |
| Japan |
127,131,800 |
61 |
4,601,461,206,885 |
3.8 |
1 |
| Mexico |
125,385,833 |
66 |
1,282,719,954,862 |
5.1 |
1 |
| Republic of Ireland |
4,612,719 |
66 |
245,920,712,756 |
5.9 |
1 |
| Russian Federation |
143,819,569 |
70 |
1,860,597,922,763 |
1 |
|
| Singapore |
5,469,700 |
73 |
326,933,043,801 | 2.9 |
1 |
| South Africa |
54,001,953 |
65 |
349,817,096,206 |
6.0 |
1 |
| Sweden |
9,689,555 |
63 |
570,591,266,160 |
6.5 |
1 |
I also made a quick alluvial diagram to visualise the same data in a different way:
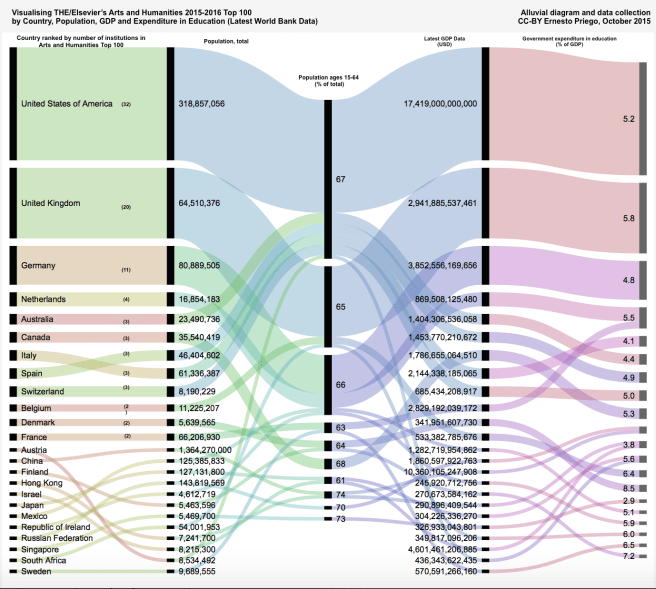
by Country, Population, GDP and Expenditure in Education (Latest World Bank Data)
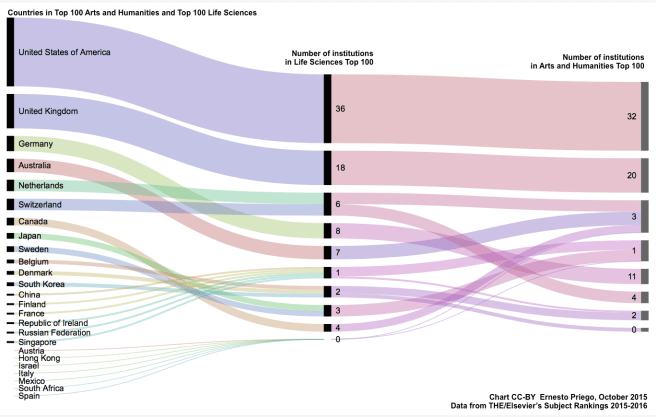
[Update]. On 28 October 2015 the THE/Elsevier’s Top 100 Life Sciences rankings were announced.
I thought it would be interesting to compare which countries were represented in both Life Sciences and Arts and Humanities and with how many institutitons and which countries had institutions in both lists and which didn’t, so I made the following table:
| Countries in Top 100 Arts and Humanities and Top 100 Life Sciences | Number of institutions in Life Sciences Top 100 | Number of Institutions in Arts and Humanities Top 100 |
| Australia |
7 |
3 |
| Austria |
0 |
1 |
| Belgium |
2 |
2 |
| Canada |
4 |
3 |
| China |
1 |
1 |
| Denmark |
2 |
2 |
| Finland |
1 |
1 |
| France |
1 |
2 |
| Germany |
8 |
11 |
| Hong Kong |
0 |
1 |
| Israel |
0 |
1 |
| Italy |
0 |
3 |
| Japan |
3 |
1 |
| Mexico |
0 |
1 |
| Netherlands |
6 |
4 |
| Republic of Ireland |
1 |
1 |
| Russian Federation |
1 |
1 |
| Singapore |
1 |
1 |
| South Africa |
0 |
1 |
| South Korea |
2 |
0 |
| Spain |
0 |
3 |
| Sweden |
3 |
1 |
| Switzerland |
6 |
3 |
| United Kingdom |
18 |
20 |
| United States of America |
36 |
32 |
Visualising this table as an alluvial diagram, with the ‘size’ of the countries visualised sorted according to the number of instutions they have in the Life Sciences ranking, the data looks like this:
[Update]. On 4 November 2015 Times Higher Education announced the “World University Rankings 2015-2016 by subject: social sciences” results. The “Subject Ranking 2015-2016: Social sciences top 100 in partnership with Elsevier” are available here.
I have now updated the comparison table above, to include the social sciences results:
| All countries in the three lists | Number of Institutions in Arts and Humanities Top 100 | Number of institutions in Life Sciences Top 100 | Number of Institutions in Social Sciences Top 100 |
| Australia |
3 |
7 |
7 |
| Austria |
1 |
0 |
0 |
| Belgium |
2 |
2 |
1 |
| Canada |
3 |
4 |
3 |
| China |
1 |
1 |
2 |
| Denmark |
2 |
2 |
2 |
| Finland |
1 |
1 |
1 |
| France |
2 |
1 |
2 |
| Germany |
11 |
8 |
7 |
| Hong Kong |
1 |
0 |
2 |
| Israel |
1 |
0 |
0 |
| Italy |
3 |
0 |
0 |
| Japan |
1 |
3 |
1 |
| Mexico |
1 |
0 |
0 |
| Netherlands |
4 |
6 |
6 |
| Norway |
0 |
0 |
1 |
| Republic of Ireland |
1 |
1 |
0 |
| Russian Federation |
1 |
1 |
0 |
| Singapore |
1 |
1 |
2 |
| South Africa |
1 |
0 |
0 |
| South Korea |
0 |
2 |
0 |
| Spain |
3 |
0 |
1 |
| Sweden |
1 |
3 |
1 |
| Switzerland |
3 |
6 |
1 |
| United Kingdom |
20 |
18 |
17 |
| United States of America |
32 |
36 |
43 |
As before, I visualised it as an alluvial diagram, using the number of institutions per country in the Life Sciences list to determine the size of each country:
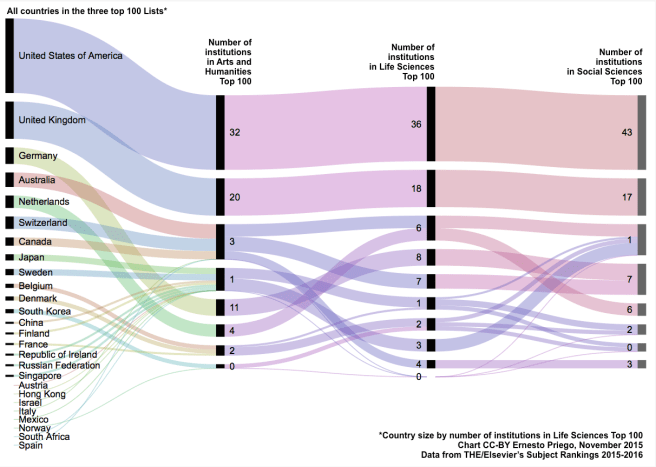
In the end, it should be clear that if you have dominance on Scopus as a country you have it (mostly) regardless of subject area. We can see that the distance imposed between the USA and the UK and the rest of the countries in Scopus is considerable in relation to number of institutions. Regardless of population or GDP what is clear is that the two countries with most institutions in the three rankings are both English-speaking. I am aware this does not tell us anything we don’t already know, but maybe underscoring it can help us think about it a bit more.
Needless to say there is much nuance that needs to be added to the data. The World Bank Data on government expediture on education, for example, refers to primary and secondary education, and it is not clear to me at the moment if it includes Higher Education as well. Private and international funding allocated to arts and humanities projects should be another column we would need to have, but locating this data in a systematic, clean and transparent manner is difficult at this time. Isabel Galina also emphasised the procedence of the rankings’ data:
Essential quotes via @igalina @GlobalOutlookDH (thanks!) pic.twitter.com/iXWIhucyG3
— Ernesto Priego (@ernestopriego) October 21, 2015
Therefore this data tables should also be complemented by insights into which arts and humanities journals are included in the proprietary database Scopus, where this journals are published in, in which languages, how are disciplines labeled, included and excluded, etc.
Unfortunately anecdotal evidence has shown that critical reflections on the geopolitics of knowledge production and institutional reputation are often dismissed as an expression of resentment from those excluded or unsuccessful. As a proud and grateful alumni of two of the institutions listed in this top 100, I can assure you it is not resentment nor negativity what motivates this commentary but a sincere desire to draw our attention to the absences and inequalities I perceive reflected in these lists.
Regardless of a researcher’s affiliation, it should not be unreasonable to interrogate critically the geopolitical and ideological component of university rankings, as well as any possible conflicts of interest. One can personally only hope there will be, eventually, more critical, rigorous insights into the methodologies and ideological and commercial interests behind these rankings, what they mean for the global Higher Education sector and society in general, and whether they should still be the measurement by which we decide who is in, and who is out.
References
Times Higher Education World University Rankings. (2015). “Subject Ranking 2015-2016: Arts and humanities top 100 in partnership with Elsevier”. https://www.timeshighereducation.com/world-university-rankings/2016/subject-ranking/arts-and-humanities#!/page/0/length/-1 Published 21 October 2015. Accessed 21 October 2015.
Priego, Ernesto (2015): THE/Elsevier’s Arts and Humanities 2015-2016 Top 100 by Country, Population, GDP and Expenditure in Education (Latest World Bank Data). figshare. http://dx.doi.org/10.6084/m9.figshare.1584624
Priego, Ernesto (2015): Visualising THE/Elsevier’s Arts and Humanities 2015-2016 Top 100 by Country, Population, GDP and Expenditure in Education. figshare. http://dx.doi.org/10.6084/m9.figshare.1584626
Priego, Ernesto (2015): Alluvial diagram comparing the number of institutions per country included in THE/Elsevier’s Life Sciences Top 100 and the Arts and Humanities Top 100 2015-2016. figshare. http://dx.doi.org/10.6084/m9.figshare.1588800
Priego, Ernesto (2015): Alluvial diagram comparing the number of institutions per country included in THE/Elsevier’s Arts and Humanities, Life Sciences and Social Sciences Top 100 2015-2016. figshare. http://dx.doi.org/10.6084/m9.figshare.1593207
World Bank Data: http://data.worldbank.org

You must be logged in to post a comment.