The London-based article-level metrics provider Altmetric published a list of their top 100 highest-scoring articles yesterday (access the full Top 100 list). For essential context, please read the accompanying blog post by Cat Chimes here, as well as her “Unwanted attention?” November 14 2014 post here. This recent post on how Altmetric tracks global news will also be relevant to understand the context of the list.
If you are new to altmetrics please read
- “What does Altmetric do?” https://www.altmetric.com/whatwedo.php and
- “How is the Altmetric score calculated?”, http://support.altmetric.com/knowledgebase/articles/83337-how-is-the-altmetric-score-calculated
I am interested in how bibliographic datasets can be subject to ‘distant reading’: can we learn something from looking at what words are used in the titles of articles being mentioned online by larger audiences? Are there any correlations between wording in title, topic, methodology, discipline, or region and an output’s access type?
I won’t even attempt to answer these questions on a blog post… but in the meanwhile I wanted to share with you a cloud visualisation of the 100 article titles I made with Voyant Tools:
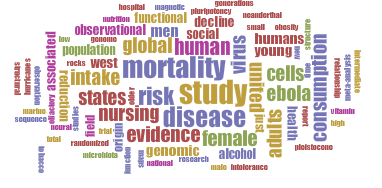
With Voyant we can also find out which are the 50 most-frequent words in the 100 journal article titles and their counts:
| mortality | 6 |
| study | 6 |
| disease | 5 |
| risk | 5 |
| adults | 4 |
| cells | 4 |
| consumption | 4 |
| ebola | 4 |
| evidence | 4 |
| female | 4 |
| global | 4 |
| human | 4 |
| intake | 4 |
| nursing | 4 |
| states | 4 |
| united | 4 |
| virus | 4 |
| alcohol | 3 |
| associated | 3 |
| decline | 3 |
| field | 3 |
| functional | 3 |
| genomic | 3 |
| health | 3 |
| humans | 3 |
| just | 3 |
| men | 3 |
| observational | 3 |
| origin | 3 |
| population | 3 |
| reduction | 3 |
| social | 3 |
| west | 3 |
| young | 3 |
| academic | 2 |
| african | 2 |
| alzheimer | 2 |
| association | 2 |
| autism | 2 |
| behavior | 2 |
| brain | 2 |
| cardiovascular | 2 |
| causes | 2 |
| cave | 2 |
| cell | 2 |
| change | 2 |
| chelyabinsk | 2 |
| childhood | 2 |
| cognitive | 2 |
| cohort | 2 |
Altmetric’s list usefully labeled the articles in their list by access type (open/paywalled): 37 of the articles in the top 100 were published as open access (63 were originally published under the paywall/subscription model). Again using Voyant, this is the word cloud of the 37 open access articles in the list:
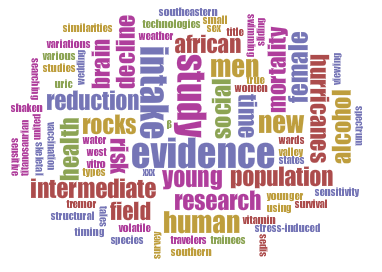
And the list of the top 50 most-frequent words of the 37 OA journal articles in the list:
| evidence | 3 |
| intake | 3 |
| study | 3 |
| african | 2 |
| alcohol | 2 |
| brain | 2 |
| decline | 2 |
| female | 2 |
| field | 2 |
| health | 2 |
| human | 2 |
| hurricanes | 2 |
| intermediate | 2 |
| men | 2 |
| mortality | 2 |
| new | 2 |
| population | 2 |
| reduction | 2 |
| research | 2 |
| risk | 2 |
| rocks | 2 |
| social | 2 |
| time | 2 |
| young | 2 |
| academic | 1 |
| acid | 1 |
| actions | 1 |
| age | 1 |
| alzheimer | 1 |
| american | 1 |
| angular | 1 |
| animalia | 1 |
| anticonformists | 1 |
| argentina | 1 |
| assault | 1 |
| assessing | 1 |
| associated | 1 |
| association | 1 |
| australia | 1 |
| autism | 1 |
| bad | 1 |
| bathyal | 1 |
| behavior | 1 |
| black | 1 |
| bodily | 1 |
| bond’s | 1 |
| boys | 1 |
| brain-to-brain | 1 |
| burdens | 1 |
| byproducts | 1 |
By having the data as a .csv file it was easier for me to find out quickly that the open access articles in the Top 100 list were published in the following 14 journals and repositories (from highest to lowest score):
| Proceedings of the National Academy of Sciences of the United States of America |
| Frontiers in Zoology |
| British Medical Journal |
| arXiv |
| PLOS ONE |
| Scientific Reports |
| Cell |
| Environmental Science & Technology |
| PLOS Medicine |
| Cell Metabolism |
| Neurology |
| Translational Neurodegeneration |
| Journal of Neuroscience |
| SSRN |
I have deposited on figshare a spreadsheet with the list of the 37 open access articles, including journal/repository names, URLs, published dates and region of authors affiliations.
Priego, Ernesto (2014): A List of the 37 Open Access Outputs Most-mentioned Onine in 2014 According to Altmetric. figshare.
http://dx.doi.org/10.6084/m9.figshare.1266304
For what it’s worth these were the open access outputs that were most-mentioned online according to Altmetric in 2014. Let’s see what happens next year.
As part of my ongoing research I also made this alluvial diagram visualising access type by number of outputs per category, which exemplifies quite directly in my opinion, at least from this specific distance, the dominance of certain disciplines in terms of article-level metrics, but also certain’s disciplines preference within this particular corpus for particular access models.


You must be logged in to post a comment.