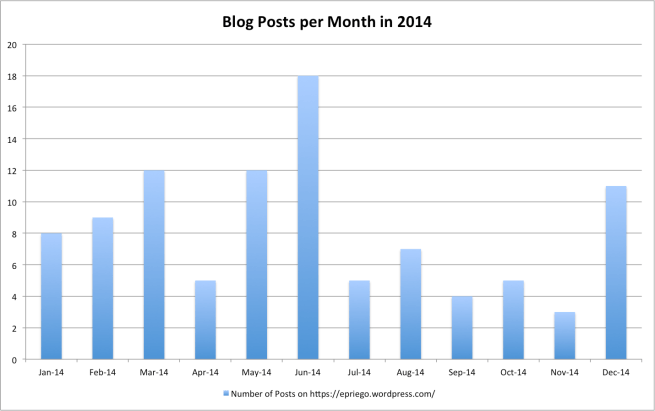
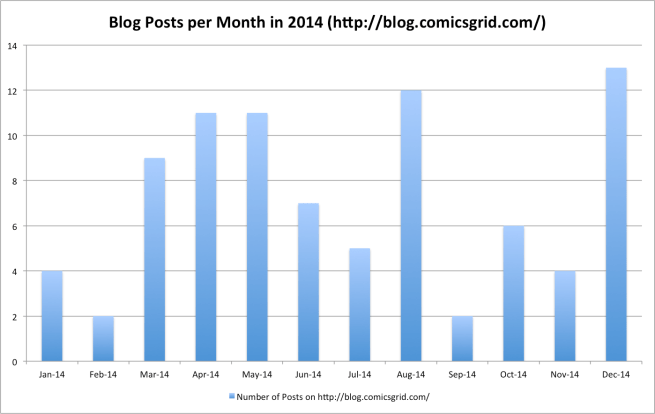
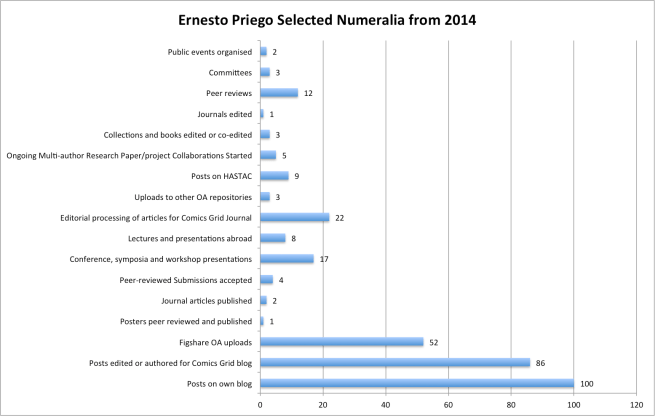
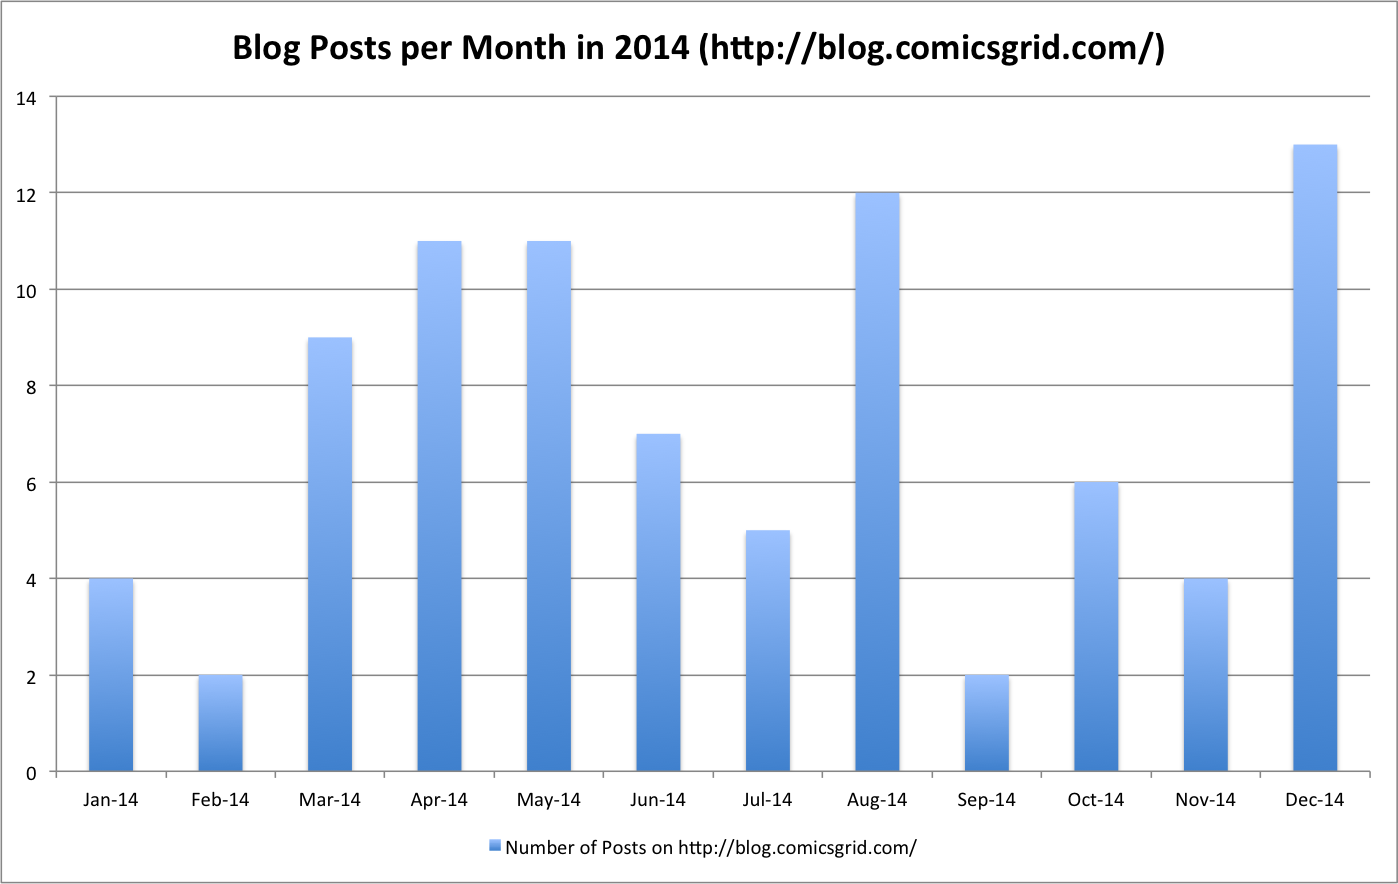
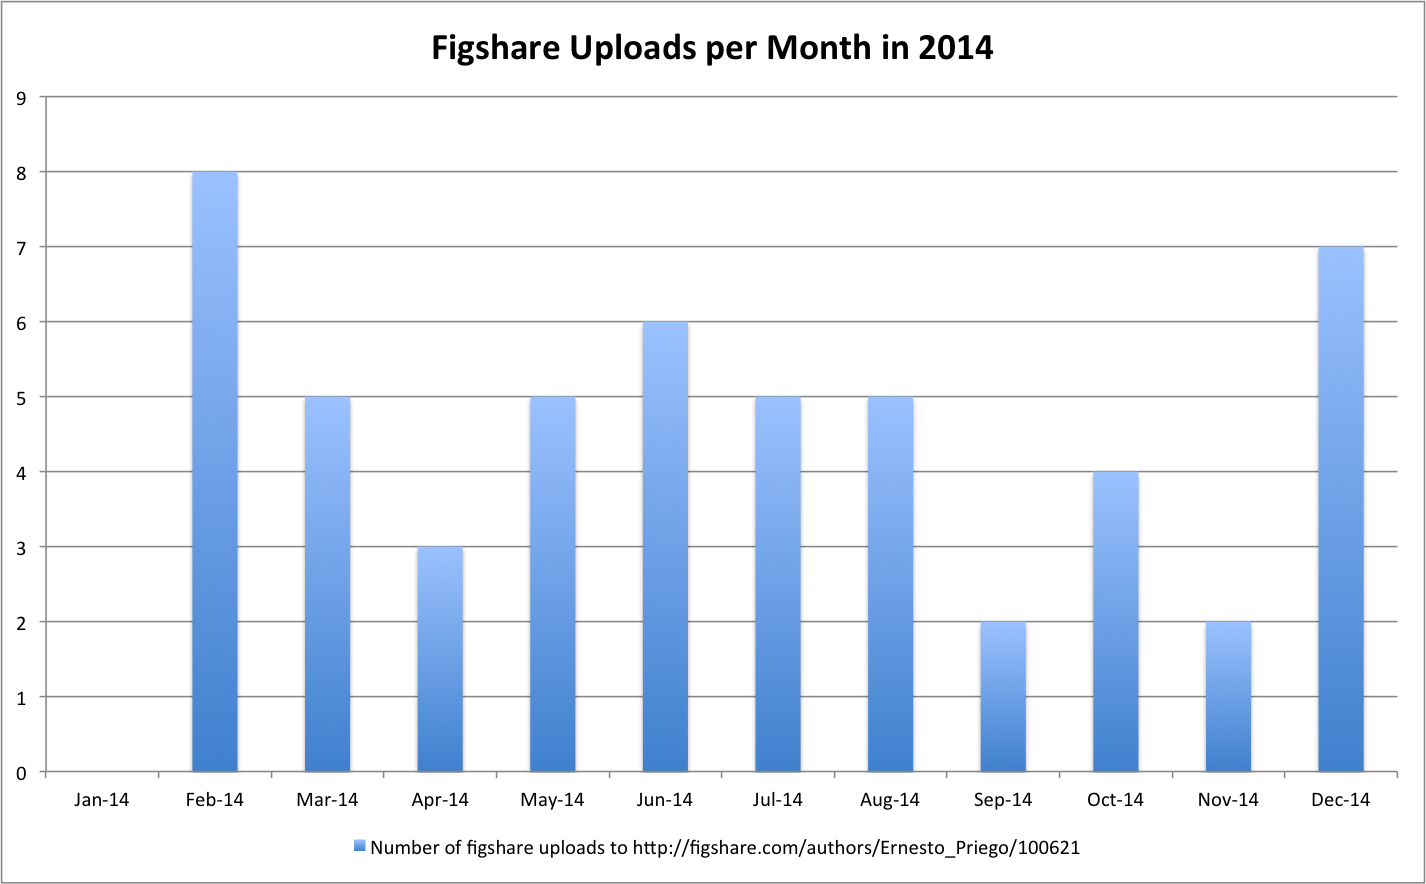
Here an attempt to visualise what I was up to in 2014 publishing, research and teaching engagement wise. I have focused first on how many blog posts I published on this blog per month, how many blog posts I edited and/or authored for the Comics Grid blog, how many outputs I shared on figshare and finally a general numeralia of some main categories of my 2014 activity.
This post is not meant to contribute to heighten already-pervasive anxieties of academic productivity (I’m fully aware most of this activity does not ‘count’ for many anyway), but merely as a humble, personal yet public exercise of reminding myself of the work I’ve done. You can click on the charts to enlarge them.
Happy new year everyone! See you in 2015!

Published by Ernesto Priego
My passion is creating opportunities for discovery, creativity and innovation. I am an advocate for enhanced access to information as a public good. I enjoy fostering engagement and openness, facilitating collaboration and mentoring.
My main focus is multi-disciplinary and involves practically and theoretically connecting the dots between varied, closely-related fields and topics: comics studies; human-computer interaction design, library and information science, digital humanities, scholarly communications, publishing studies, digital innovation and material culture, intellectual rights and open science, access, data and educational resources.
I love writing and spreading the word about the things I believe in. I love higher education and the Internet and I define myself as a digital scholarship advocate. I love working collaboratively and on my own. You can still follow me and/or contact me via Twitter @ernestopriego.
View all posts by Ernesto Priego


You must be logged in to post a comment.